Electoral Vote Step Functions
In predicting the 2020 presidential election, we employed a bottom-up approach, drawing of extensive data from PredictIt.
PredictIt managed fifty-six (56) prediction markets for the 2020 presidential election. These corresponded to Electoral College voting units or markets. For forty-eight states, there is one winner-take-all market. Maine has three markets. Nebraska has four markets, and there is one market for the District of Columbia.
PredictIt, our preferred source of prediction market data, is managing a much smaller number of markets in 2024. So, we are using a top-down approach to Electoral College vote forecasting, as discussed in the Top-Down Forecasting.
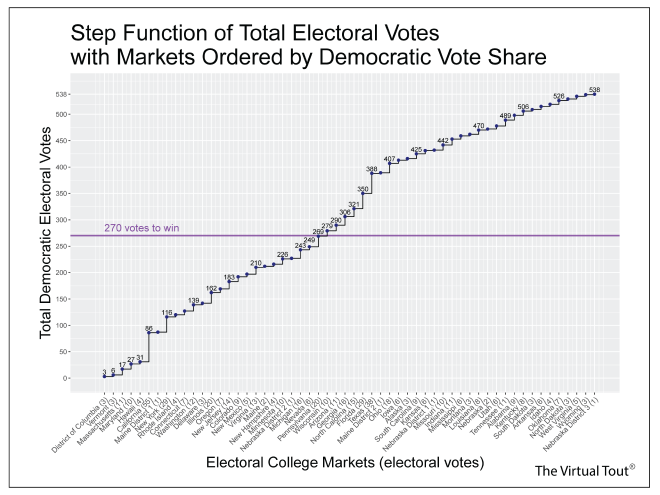
To draw inferences about the states included in Electoral College vote forecasts, we again draw on data from the 2020 election. The figure below shows the 56 Electoral College states/markets ordered from highest to lowest value of actual Democratic vote shares from the 2020 presidential election. We add states/markets one at a time in this order, obtaining the total Democratic electoral votes, as shown on the vertical axis.

To identify states/markets most likely to be included in the Democratic vote total, we refer to this figure, reading all the states/markets that would be needed to obtain the forecasted Electoral College vote total or just under that forecasted vote total.
Consider a simple example to demonstrate the method of identifying states/markets captured by the Democratic ticket when the forecast is 100 electoral votes. Reading from left to right, we would include the District of Columbia (3), Vermont (3), Massachusetts (11), Maryland (10), Hawaii (4), California (55), and Maine District 1 (1). This would give 87 electoral votes (a value under 100). We would not include New York (29) because that would take us to 116 electoral votes (a value larger than 100).
Identifying states/markets indirectly within a top-down forecasting framework is not as accurate as identifying states/markets directly within a bottom-up framework. But it is a realistic, past-election-informed way of answering questions about which states are included in a party total.
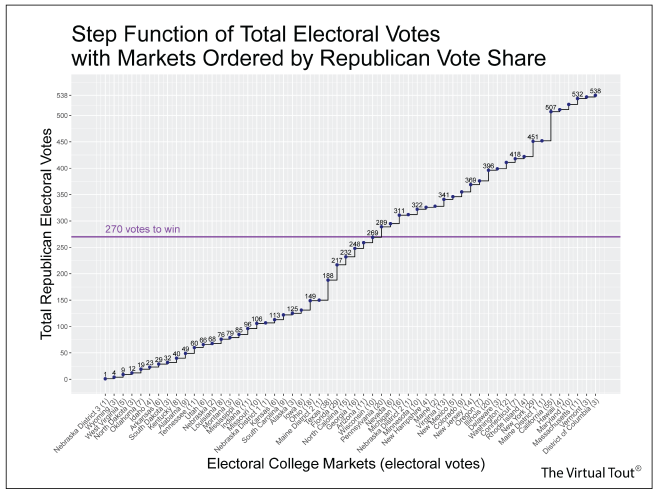
We would employ the same process for finding states/markets associated with a Republican electoral vote.

The figures for Democratic and Republican totals show how electoral votes grow as they move from 0 to 538. States/markets are added one at a time, with associated numbers of electoral votes. These are step functions. Large steps are aligned with the entry of California (55), Texas (38), and New York (29). Daily forecasts from The Virtual Tout®, on the other hand, take all possible integer values from 0 to 538.
Back to Methods.
Go to the home page of The Virtual Tout.