Initial and Revised Models for 2024
In predicting the 2020 presidential election, we employed a bottom-up approach, drawing of extensive data from PredictIt.
PredictIt managed fifty-six (56) prediction markets for the 2020 presidential election. These corresponded to Electoral College voting units or markets. For forty-eight states, there is one winner-take-all market. Maine has three markets. Nebraska has four markets, and there is one market for the District of Columbia.
With a bottom-up approach, it is possible to work directly with prediction market prices from each of the Electoral College markets using a normalization formula for two-party prices:
When predicting the presidential election in 2020, with normalized prices in hand, we would run one million simulated elections every hour, treating normalized prices as though they were probabilities. Mean electoral votes from these simulations were reported as hourly estimates.
In 2024, PredictIt, our preferred source of prediction market data, has been managing a much smaller number of markets. So, we have adopted a top-down approach to Electoral College vote forecasting, as discussed in Top-Down Forecasting. A top-down approach requires estimates of two-party vote shares.
Using two-party normalized prices directly as estimates of two-party vote shares works fine as long as those normalized prices are close to 0.50 (as in a toss-up election). But as the prices of Democratic and Republican tickets diverge, normalized prices become less appropriate as estimates of two-party vote shares.
Beginning with the reporting of end-of-day forecasts on September 22, 2024, we have been using a generalized linear model to estimate two-party vote shares, as shown in Estimating Vote Shares. In this way, guided by data from 2020, we bring two-party vote shares in line with expectations about the election.
The figure below shows forecasts for September 24, 2024 from the original and revised models. The result is a “rescaling” of the electoral votes axis. Relative electoral vote forecasts (trends across current and campaign events) are consistent between the original and revised models.
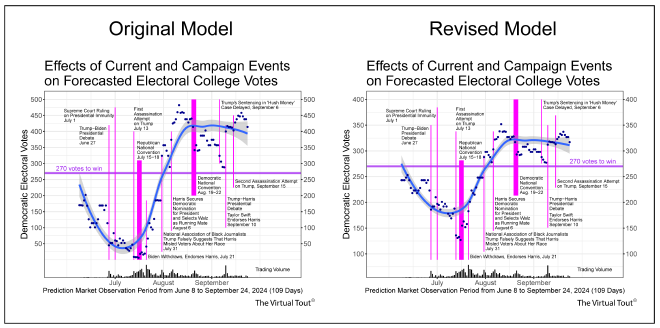
What might have been described as a “Democratic landslide” using the original top-down model is better described as a “strong Democratic victory” with the revised top-down model.
Daily forecasting is now using the revised top-down model.
Back to Methods.
Go to the home page of The Virtual Tout.