Top-Down Forecasting
Predicting the 2024 Presidential Election #
The Virtual Tout® is employing a top-down approach in 2024, drawing on sixty years of presidential election history.
We will be posting forecasts until election day, November 5, 2024.
The US president is elected by obtaining a majority of Electoral College votes, not popular votes. Beginning with the election of 1960, there have been 538 Electoral College votes, so 270 votes are needed to win.
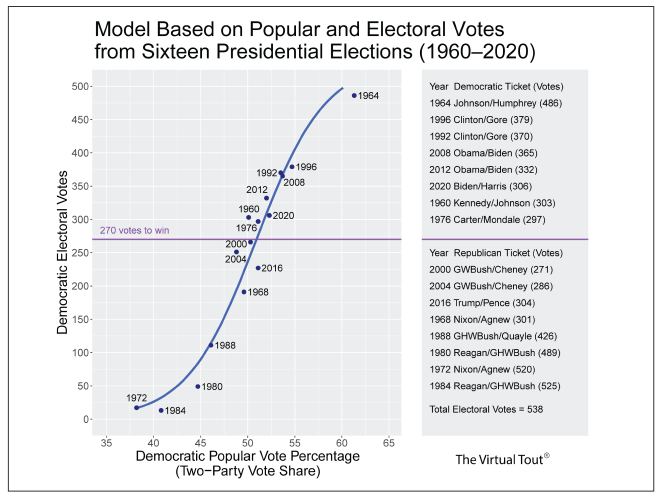
There is a strong (although not perfect) relationship between nationwide popular vote shares and Electoral College votes. The graph below shows the observed relationship between popular vote shares and Electoral College votes for Democratic Party tickets from 1960 through 2020. There were sixteen presidential elections during this period, with eight Democratic wins falling above the purple win line and eight Republican wins falling below the line.

The Virtual Tout® employs a top-down approach to forecasting Electoral College votes in the 2024 presidential election. We draw on well-established historical trends identified in the above figure. The curved blue line shows a model for predicting Electoral College votes from popular vote shares. The root mean squared error of prediction (RMSE) of this model is about 30 Electoral College votes, and the mean absolute error (MAE) is about 24 votes.
Estimation of two-party vote shares is a critical component of the forecasting method. For this we draw on prediction market and actual voting data from the 2020 presidential election. The method is described under Estimating Vote Shares.
Also from our work on the 2020 presidential election, we detected a small Republican bias in prediction markets. Forecasted Democratic Electoral College votes from prediction markets tend to be slightly lower than actual Democratic Electoral College votes. It is appropriate to correct for this small Republican bias in predicting future presidential elections, including the election of 2024.
Estimates of two-party vote shares are based on closing prices from a PredictIt prediction market. PredictIt is an experimental project operated for academic purposes, with initial permission from the Commodities Futures Trading Commission (CFTC). PredictIt describes itself as “the stock market for politics.” Each market/contract concerns a specific political event and bears an individual share price between 1 and 99 cents. Share prices change over time, reflecting traders’ beliefs about the probabilities of political events. The investment in each market/contract is limited to $850. This limits the influence of any individual trader on market prices.
On August 2, 2022, the CFTC issued an Order to PredictIt to close its political prediction markets by February. 15, 2023. While that order is under appeal, PredictIt continues to offer a number of political futures contracts.
The PredictIt market/contract for the party that will win the 2024 presidential election provides a key data source for The Virtual Tout® model. We use closing daily prices from this prediction market to estimate vote shares for the Democratic and Republican tickets, excluding any third-party voting. Across the first 92 days of observation, the average daily two-party trading volume in this highly active prediction market was around 37 thousand shares.
We have seen massive changes in forecasted Electoral College votes in recent months, as shown on the time series plot displayed on the home page.
The presidential election of 2024 resembles the election of 1964, which pitted a radical, far-right Republican candidate (Barry Goldwater) against a center-left Democratic candidate (Lyndon Johnson). See the News posting from August 5. Does this imply a Democratic Party landslide, as observed in 1964? Time will tell.
Even with a top-down approach to election forecasting, it is possible to draw inferences about individual states/markets included in Electoral College vote totals. See Step Function of Electoral College Votes that shows how.
Back to Methods.
Go to the home page of The Virtual Tout.