Focus on Electoral Votes
The Virtual Tout® expresses forecasts in electoral votes because the winner of the presidential election is determined by ballots cast by electors in the Electoral College. There are 538 possible electoral votes, and a majority of votes (270) is needed to win.
A count of electoral votes is parsimonious—a single number summarizing a modeling process with many steps. One metric replaces the many percentages, probabilities, and prices cited in the media. We use this electoral vote metric to track the progress of campaigns across time.
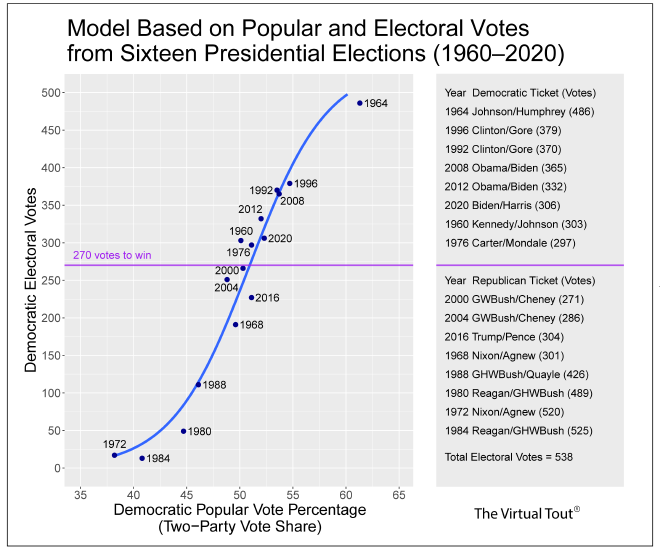
To gain an understanding of electoral vote counts, we look at the last sixty years of presidential election history. In 2000, the Republican ticket of Bush/Cheney (with the Supreme Court’s help) received 271 electoral votes, one more than the 270 needed to win the election. Four years later, the Bush/Cheney ticket received 286 electoral votes. In 1976, the Democratic ticket of Carter/Mondale won 297 electoral votes, 27 more than the 270 needed to win. These were extremely close or toss-up elections.
Reviewing the results of the past sixteen elections, we can see that eleven elections were won with fewer than 400 electoral votes. These were contested elections.
Landslide elections—elections in which the winning party secures 400 or more electoral votes—are less common. There have been five landslide elections in the past sixty years. Four landslide elections were Republican victories and one Democratic. As we can see from the summary figure, 400 electoral votes corresponds to earning at least 55 percent of the popular vote using a two-party vote-share metric.

Binary Forecasts #
Allan Lichtman (2024) provides binary election forecasts. Using on his “Keys to the White House,” he predicts whether the challenging or incumbent party will win the presidential election. Lichtman’s forecasts are straightforward, but forecasts far in advance of election day fail to capture the influence of campaign events, candidate messaging, political advertising, debates, and get-out-the-vote efforts.
Using machine learning models, we can use data from Lichtman’s “Keys” to turn binary forecasts into probability statements. For example, we presented an updated analysis of historical data from 1964, comparing that Democratic landslide year with 2024. See the analysis in the October 2 posting.
Percentages #
Political commentators spend an inordinate amount of time presenting percentages and interpreting percentage differences and margins of error from a plethora of polls, many of which have questionable value. People often feel overwhelmed by the many numbers coming their way.
How do percentage differences translate into electoral votes?
Polling percentages and percentage differences can be difficult to interpret, in part due to the presence of respondents with third-party preferences. For ease of interpretation (and relevance to election forecasting), it makes sense to express polling results as estimated two-party vote-share percentages, ignoring third parties.
We review polling issues in Political Polling Today.
Probabilities #
Many analysts and modelers present election forecasts as probability estimates. Probabilities may flow from a classical (frequentist) perspective, reflecting proportions of Republican and Democratic victories across large numbers of simulated elections. The Virtual Tout® provided probability forecasts, as well as electoral vote forecasts, for the 2020 presidential election. We employed a bottom-up approach, as described in Forecasting Methods.
Alternatively, probability statements may come from Bayesian models, with prior probabilities based on past election data (or perhaps analyst subjective opinion) updated through Bayes theorem to provide posterior probabilities. It is common to use recent polling data for Bayesian updates. Andrew Gelman (writing for The Economist), Nate Silver, and FiveThirtyEight are known for taking a Bayesian approach, as described under Political Polling Today.
Many people are justifiably wary of probability statements about election outcomes. Statistical simulations and Bayesian methods, although lauded by the analysts and modelers who use them, are not well-understood by the general public. Just as the percentages emerging from polls vary greatly from one pollster to the next, probabilities from models vary greatly from one modeler to the next.
How do probabilities relate into electoral votes? There are distributions of electoral vote outcomes from statistical simulations, as we provided when comparing models for the 2020 presidential election under Forecasting Methods.
Prices #
Prediction markets include PredictIt, the Iowa Electronic Markets, and Polymarket, as reviewed under Prediction Markets.
Investors or betters in prediction markets buy and sell shares of political futures contracts associated with candidates or parties. Currently, The Virtual Tout® is drawing prices from a market/contract for Which party that will win the 2024 presidential election? This market has contract options and prices for four parties. At 9 pm EST on October 3, 2024, the quoted prices were as follows: Democratic (56 cents), Republican (49 cents), Libertarian (1 cent), and Green (1 cent).
Recognize that prices cannot be construed as probabilities. Using the prices from October 3 we have
0.56 + 0.49 + 0.01 + 0.01 = 1.07 (not 1.00).
We can estimate a two-party normalized Democratic probability of winning:

Again, using the prices from October 3, we would have
0.56 / (0.56 + 0.49) = 0.533.
A two-party normalized probability of winning is assured of taking values between zero and one, just as popular two-party vote shares take values between zero and one. But we must be cautious when interpreting normalized two-party probabilities generated from prices. Extremely high or low prices distort the estimation of vote shares.
Political commentators sometimes interpret prediction market prices as probabilities. Prices are not probabilities. Nor are they accurate estimates of vote shares, as shown in Estimating Vote Shares.
Electoral Votes as a Forecasting Metric #
The Virtual Tout® employs an electoral vote metric that reflects candidate or party strength. The metric takes all possible values between zero and 538. For ease of reporting, we round these values to the nearest integers.
Our electoral vote metric is not an exact number of electoral votes, as would be obtained by summing across electoral votes of states that a candidate wins. Rather, we employ a top-down modeling process. After a forecasted number of electoral votes has been obtained, we can infer states included in that forecast using Step Functions of Electoral Votes.
Forecasted electoral votes represents a parsimonious metric. One “V” (votes) is better than three “Ps” (percentages, probabilities, and prices).
Lichtman’s Book #

- Lichtman, Allan J. 2024. Predicting the Next President: The Keys to the White House (2024 Edition). Lanham, Maryland: Rowland & Littlefield. [ISBN-13: 978-8881800710] Amazon Associates Paid Links: Hardcover, Kindle.
Back to Methods.
Go to the home page of The Virtual Tout.